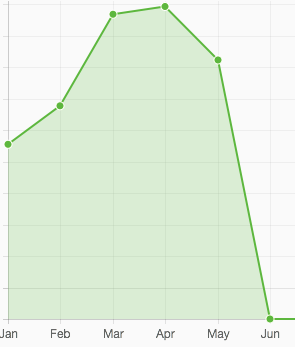
Here’s my sales graph for this year. The growing sales from january to march could be a result of a larger portfolio and the slight dip in May could be caused by me not uploading anything between April 10th and May 23rd. That could be evened out in the last days of May though.
I don’t have many sales each month so just a few sales less make a big bump in the sales graphic.
